BREAKING NEWS

I have accepted an offer to work at Third Point this summer!

ARON FRISHBERG

Graph of Ivy Plus Endowments (2014 - 2024)


Graph of Ivy Plus Endowments (2014 - 2024)

For accuracy, I manually the endowments over the past 10 years of the "Ivy Plus" institutions. This definition is put forward by the Ivy Plus Consortium, and the definition is maintained by each of its member institutions. This group generally consists of the most elite universities in the US, including the Ivy league (Princeton, Harvard, ...) as well as other extremely elite universities (MIT, UChicago, ...). These schools also have some of the largest endowments in the world, ranging anywhere from $4B to $50B.Click to view.

Just One A Podcast


Just One A Podcast

During the finals week of my first semester at Brandeis, I had the idea to start a podcast where I interviewed people from the Forbes 30 Under 30 list and asked them about their experiences starting companies and just about their lives in general.

It was one of the hardest projects I've ever undertaken, including many many unanswered emails, but within two months I had interviewed 15 people from the 2023 Forbes 30 Under 30, as well as Holly O'Neill, the President of Retail Banking @ BofA. Click to view.

Record Labels of the Top 100 Artists


Billboard Top 100 Artist Analysis

A few years ago, I decided to research the prevalence of major record labels in popular music. I found that they basically produced everything, unsurprisingly, although there is a rise in popular independent artists with the democratization of technology and information.

With this project, I wanted to create a tool to analyze the labels of the Billboard Top 100 Artists. I coded it so that the data would be updated daily (as can be seen in Datasets) so the tool will always be a live analysis of the major labels behind the major artists. Click to view.

Universities with the Most Nobel Prizes


Universities with the Most Nobel Prizes Data

Heading off to the University of Chicago, I kept hearing that UChicago had a crazy amount of Nobel Prizes. As an amateur data scientist, I decided I needed to put this to the test.

Using Python, I coded a program that scraped a list of all Nobel Prize winners from Wikipedia, and then scrape each laureate's wikipedia page to find their academic affiliations (including alma matters and institutions where they've worked). I then created this page, which allows for analysis of the data. This includes filters to allow for specific prize categories, specific time periods and restricting the type of academic affiliation. Click to view.

Chess-Analytica


Chess-Analytica Python Library

This idea began a while ago when I coded a project I called "Not Stockfish". Stockfish is currently the best chess engine in the world, and plays essentially flawlessly. On the other hand, I'm barely breaking 900 elo on chess.com, so I thought it would be interesting to create an engine that ran off of my moves.

Over the course of the next week or so, I ended up doing just that. It involved interfacing with the chess.com API, and a bunch of work.

I've always wanted to create an open source library of my own and so a few months later, I had the idea of creating a Python library that made chess analytics way easier (by making both scraping and analysis simpler). That is the story of how chess-analytica began. Click to continue.

Frishberg Chess Structure


Frishberg Chess Structure

This all began with a simple idea: an "indestructible" chess structure. Looking at a pawn to the back left of a bishop, we see that they each protect eachother, thus making an "indestructible" chess structure. I had the idea to take this further though. As a result, I coded a complex Python program that created chess structures until it created the "optimal" structure.

The basic idea behind it was to find a structure of pieces where every piece was protected by another, and every piece was protecting at least one other piece. Click to continue.

01 Theory


01 Theory

In 8th grade, I had the idea for a mathematical theory: 01 Theory. The basic idea is that if you analyzed all numbers, from negative to positive infinity, and counted the number of '1's and '0's that appeared in the numbers (ex. 10165 has 2 '1's and 1 '0') that the 1s would not only out number the 0s, but by an infinite amount.

This is due to the simple fact that a number can start with a 1 but not a 0. In any place that a 0 can appear, a 1 could take its place, but this is not correct the other way around, due to the fact that a number can start with a 1. As a result, there will be an infinite number more 1s than 0s.

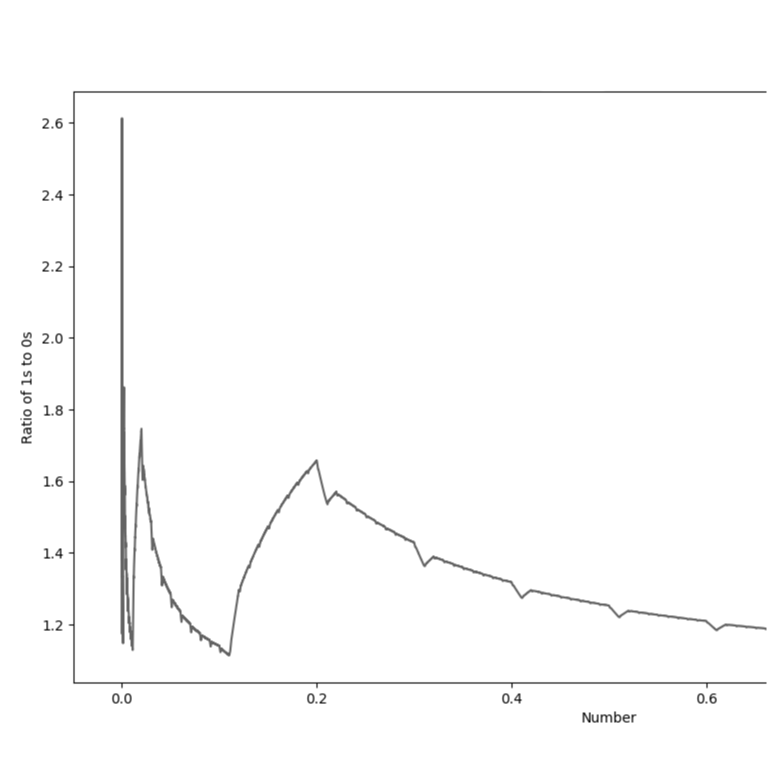
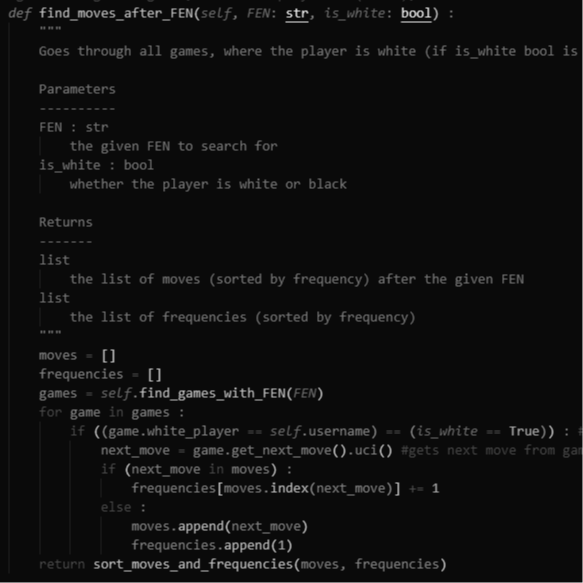
Using my new programming skills, I coded a program in Python that analyzes the ratio between 1s and 0s and uses MatPlotLib to create a graph. The graph can be seen above. As can be seen, the ratio always remains above 1, as there will always be more 1s than 0s, however, the graph tends downward (to an asymptote of 1) as the numbers get larger.

Analysis: This is because if we think about why the ratio is above 1 at all, is because of the first digits of numbers. Click to continue.

Collatz Conjecture Art


Collatz Conjecture Art

Collatz Conjecture (or the 3n+1 problem) is a famous idea within the field of mathematics. It is known in the field for being an unsolvable problem with "experienced mathematicians even going as far as warning up-and-comers to stay away". The idea behind the conjecture is actually quite simple: taking any number, if it is even, divide it by 2, and if it is odd, multiply it by 3 and add 1. Continue this process until you reach 1. The conjecture states that no matter what number you start with, you will always reach 1. Mathematicians have tried for ages find a pattern in this process, but all have failed. Click to continue.

Graphing Tool for US News Rankings (1984 - 2024)


Graphing Tool for US News Rankings (1984 - 2024)

Each year, the magazine U.S. News ranks college in the United States, as well as internationally. This practice, and the fundamental ideas behind rankings, have come under much scrutiny recently, as people feel it's misleading, unfair, and "gameable". However, I thought this would be a challenging data project, so I decided to take it on.

Using Python, I collected all U.S. News rankings for "significant" colleges in the United States dating back to 1984, the year that the rankings began. This data is available in a data format on my github. I then used that data, along with chart.js, to make an interactive graphing tool that allows you to see how a college has changed in the rankings over time. Click to view.